I asked a bunch of people (~19k) what kinks they were into, and as an almost-afterthought asked people what quadrant of the political compass they were on.
Almost all the political-fetish correlations were uninterestingly weak, but the sample size was huge enough that it became very unlikely that the correlations were showing up due to chance. So, for fun, I put them on a political compass chart.


The charts were done by adding authleft and authright answers (to get auth answers), libright and authright (to get right answers), etc. and then checking fetish correlations with these (as I now had auth, lib, right, left). I then combined the auth-lib correlations and the right-left correlations via subtraction into one point, and then plotted those points.
The fetishes are shaded from grey to black, with darker equivalent to more taboo. You can find the original findings from my taboo survey here.
You’ll notice in the above graphs, there’s a distinct diagonal skew. I tried to “undo” the skew a bit so that things were more equally spread out for the purposes of joyful memeage, however the actual data was way more clustered around the trendline.
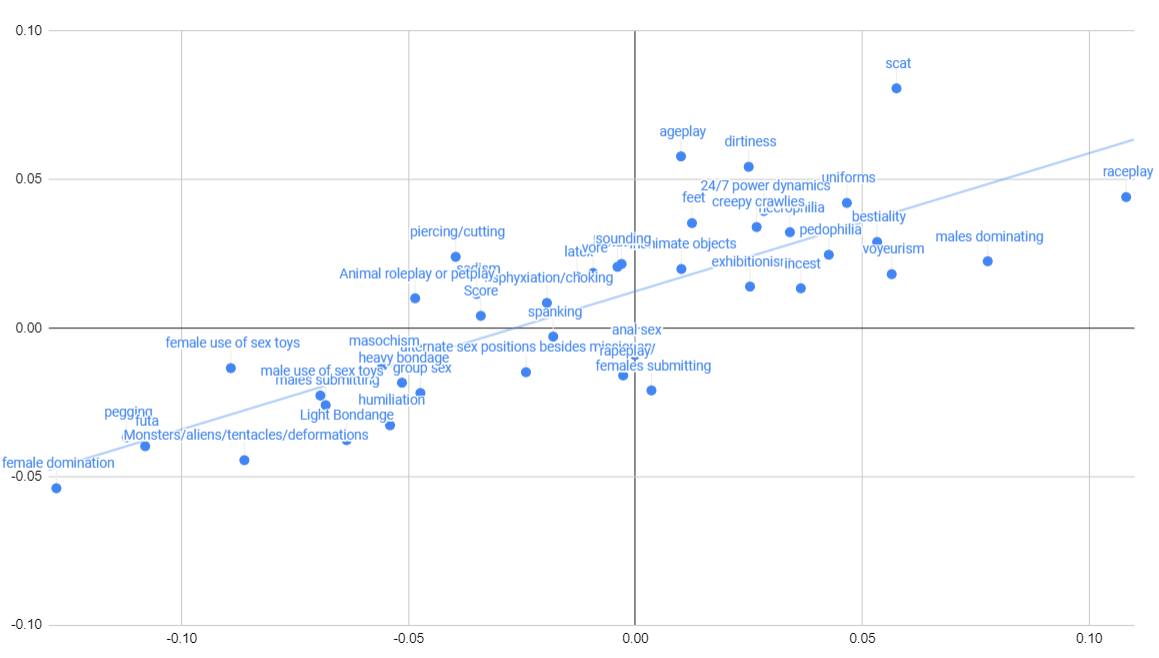
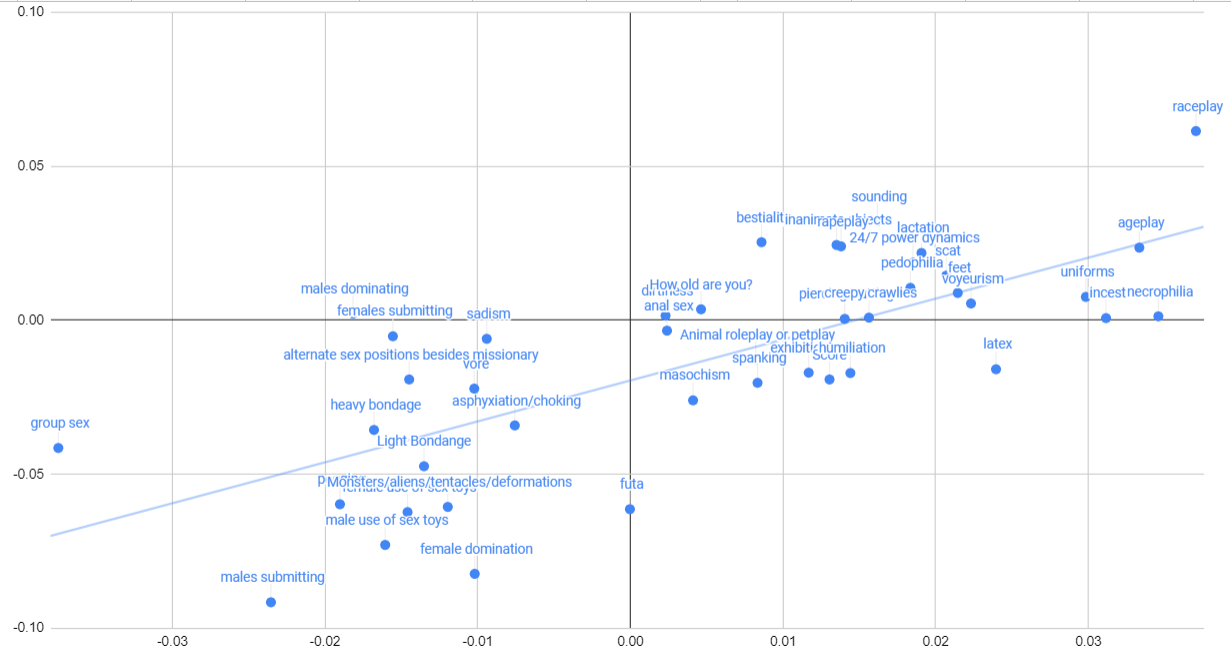
The cluster around the trendline is interesting and really confusing, for me. It looks like there’s something politically that’s predictive of fetish, but that something is mostly a left-right spectrum with a little bit of lib-auth skew? Why would this be? I don’t know how to think about this and am very curious for theories.
Also, not included in the memegraphs cause it would require too much explanation – the “Score” is also listed as a point, which corresponds to the total tabooness of the fetishes for the person answering (a simple adding a tabooness score for each fetish they marked being into, with higher scores for being more into it). For the male graph the highest taboo score exists in libright, and for females it’s near the border in authleft).
Both men and women were more likely to be gay if they identified as libertarian-left ((r=0.1 and r=0.21, respectively).
Surprisingly, I found basically no correlation with age and location on the graph (except for maybe liblefts being younger if you squint). This makes me feel slightly unsettled, as I had a lot of weight on “political orientation is stratified by age.”
But in general, the political compass isn’t a great graph; I asked people to self-identify, and didn’t place them based on diagnostic questions. I suspect people overreport being libertarian, because libertarian is a nicer word than authoritarian.
“sample size was huge enough that it became very unlikely that the correlations were showing up due to chance”
^
Thats THE number 1 ONE conclusion you CANNOT draw from sample size. Ice cream correlates with crime.
101 finding analysis. You have to test for this.
https://courses.lumenlearning.com/wsu-sandbox/chapter/analyzing-findings/
I suspect you’re misunderstanding. It’s not due to chance, but it could be due to other things, including confounding factors like it being hot out.
I wonder if most of this is so simple as these fetisishes are less taboo in the context of these different political communities (sadly a political view is a community?).
This seems to fit quite well with the male taboo at least, I’m not sure about why right wing people are more paedophilic, I could try to theorise but seems pointless and a bit too anti right wing people.
I will say there is of course a level of what fetishes someone will admit to, this matches my theory of the fetish being less taboo for these people but then doesn’t even tell us if it’s more prevalent.
It definitely gets complicated because I understand fetishes are mostly caused by taboo (you see the left wing women more interested in rape play…or at least admitting to be), but perhaps there is an important layer of “not too taboo”.
> “(you see the left wing women more interested in rape play…or at least admitting to be)”
Are you sure? The data shown here actually designates the maledom inclination to right-wing women, with a lower taboo score. The proverbial tradwaifus.
When I did the survey the term Libertarian as a contrast to Authoritarian was confusing. I have known anarchists who styled themselves as Libertarians but this was decades ago. Today it is more common for me to come across people who call themselves Libertarians who plainly have an authoritarian program. I would have been happier with an Authoritarian/Anti-Authoritarian contrast. Still, the results of the study are intriguing.
The diagonal thing could just be an artifact of the underlying distribution on the political spectrum. It seems like what you’ve found is that there’s a correlation between economic and authoritarian tendencies.
The reason it seems like political ideology is stratified by age is because political ideology is stratified by wealth, and wealth used to come with age. This is no longer the case, due to the wealth-funneling effects of “trickle-down” economics taking that opportunity and pushing all money into the hands of the uber-rich.
There is also a lot to be said for the fact that most older left-leaning individuals are likely the survivors of brutal suppression campaigns, especially if they’re in a country influenced in any way by the United States.
For this reason, I strongly suspect left-leaning individuals are also underreported.
Please release the full methods and metadata on this, this is fascinating!
Emma agreeing with that. Can you please create a github repository for say sanitized versions of the datasets and methods used (preferably with attributions to platforms e.g. SAS/JMP, Python, Excel, etc) and references. This is actually research quality work worthy of a peer-reviewed journal in some ways.
I liked the fact that you were honest about your assumptions (predilections) going into the data set vis-a-vis vs. what the data reveals. Glad I found this blog (albeit via NSFW routes).
In factor analysis of paraphilias, I tend to find various dimensions, but two notable ones are Genderbending/Androgyny (covering role reversal, attraction to androgynous/trans people, and autogynephilia/autoandrophilia) and Disgust/Taboo (covering zoophilia, pedophilia, bodily waste, incest and others). It seems to me that you found the Genderbending/Androgyny factor to be libleft and the Disgust/Taboo factor to be authright. At least with the Genderbending/Androgyny aspect, this aligns with my results doing surveys on reddit. It might also align in a more representative sample, e.g. YouGov found that liberal democrats were more likely to fantasize about having sex with a trans person:
https://yougov.co.uk/topics/politics/articles-reports/2016/09/05/sex-and-politics
I’m less sure about the Disgust/Taboo factor. In terms of personality, I’ve found evidence that it correlates with disagreeable/immoral personality. But is that a true correlation, or is it a question of what sort of person is willing to admit it, or what? Does the Disgust/Taboo factor even exist independent of social desirability? (I suspect yes; e.g. among furries there seems to be much higher rates of people with Disgust/Taboo themes of interest. But I’m not sure.)
Makes sense — engaging in more taboo behavior is, tautologically, a sign of disinhibition, which has a pretty robust correlation with callous and unemotional traits.
I’ve got a couple thoughts on liberals/democrats being more likely to fantasize about sex with a trans person:
1. they aren’t, and are just less ashamed to admit it than someone who has anti-trans politics
2. they have an understanding of trans people as humans and know some irl. whether or not they are fantasizing about a specific person i think that exposure would influence whether you even consider that fantasy.
3. most trans/gnc people are on the left, and we tend to fantasize about one another (i don’t have any data on this, just a thought that many trans people are t4t)